White paper: how Habivista calculates facility distances
Our method for measuring nearby schools, healthcare, markets, green space, bus stops, and flood context.
8-minute read
Summary
Habivista shows facility distances to help renters, buyers, agents, and landlords understand what is around a neighbourhood before they visit. The distances are calculated during our GIS seed and backfill process, then stored in the database. We do not call OpenStreetMap, Nominatim, Overpass, NASA EONET, Valhalla, or raster services during normal page loads.
The primary distance shown today is a straight-line distance from the stored neighbourhood centre to the mapped facility. It is useful for comparing access between areas, but it is not a promise of walking time, driving time, traffic time, or legal access through gates and private roads.
Evidence from the working system
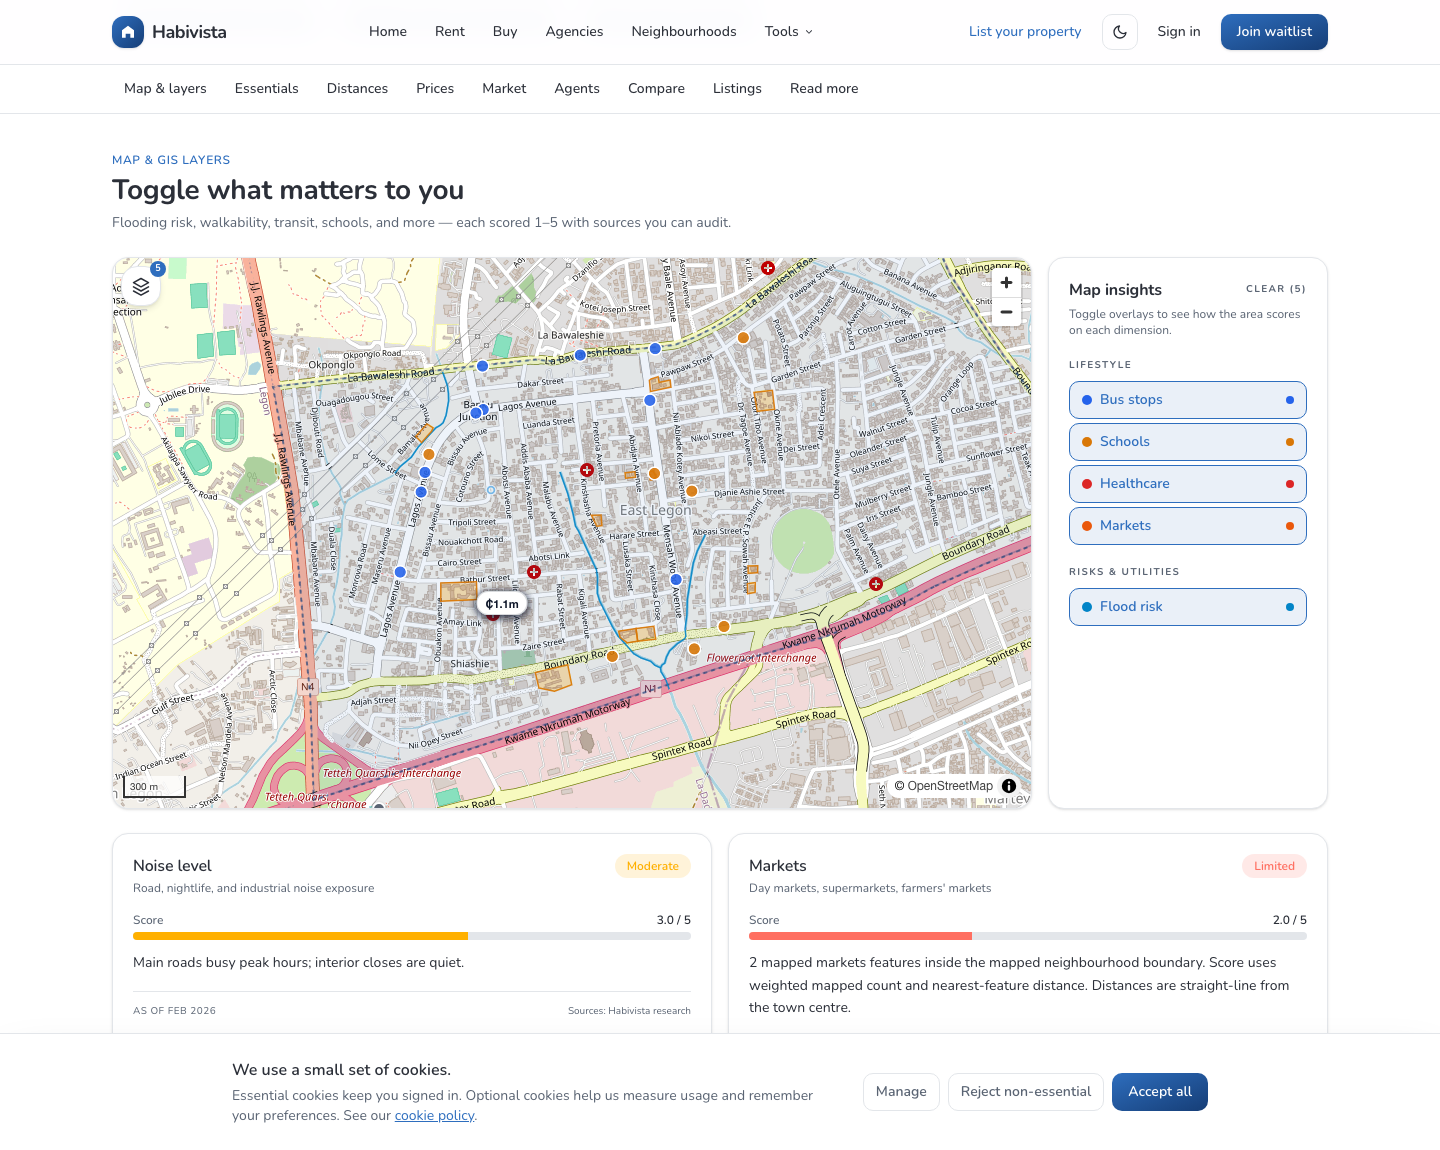
The screenshots and diagrams below are published evidence from the current QF1-backed Habivista system. The map screenshot was captured from https://test.habivista.com/neighborhoods/east-legon?layers=schools,markets,healthcare,flooding,transit#map after the national GIS seed completed.
The national verification run checks that every residential town/neighbourhood row has coordinates, a boundary geometry, and valid GeoJSON FeatureCollections for schools, healthcare, markets, green space, bus stops, and flood context.

The architecture below shows why page loads stay fast and reliable. External GIS APIs are only used during seed/backfill. The public app reads already-stored boundaries, layer metadata, and GeoJSON from the database.

What we measure
For Ghana neighbourhood and town GIS layers, Habivista currently maps these facility groups:
- Schools: OSM schools, colleges, and universities.
- Healthcare: hospitals, clinics, and pharmacies.
- Markets: marketplaces, supermarkets, and malls.
- Green space: parks, gardens, recreation grounds, selected forest or recreation landuse.
- Bus stops: OSM features tagged as bus stops. This is the drawable map layer for transit.
- Flood context: indicative nearby water features, drains, streams, canals, wetlands, and regional NASA EONET weather-event support.
The transit summary card can still discuss broader trotro, taxi, and commuter-route access. The drawable transit layer is intentionally limited to bus stops so the map does not label unrelated landmarks as transit features.
Source data
The seed process can use several sources, all at seed time:
- OpenStreetMap through Overpass for facility and water-feature tags.
- Nominatim for candidate neighbourhood boundaries.
- NASA EONET for regional flood or severe-storm event support.
- Optional local GeoTIFF raster files for green-cover evidence.
- Optional Valhalla routing for route-matrix evidence when a routing backend is configured.
Each stored feature includes auditable properties where available: name, category, source, confidence, OSM type, OSM id, and distance in kilometres.
The latest national seed loaded the following source feature pools before assigning nearby features to each town:
- Schools: 4,620 national OSM features.
- Healthcare: 2,085 national OSM features.
- Markets: 708 national OSM features.
- Green space: 530 national OSM features.
- Bus stops: 2,300 national OSM features.
- Flood and water context: 10,380 national OSM water-related features.
- NASA EONET support: 1 Ghana-area flood or severe-storm event in the configured evidence window.
The core distance formula
For the current V1 distance field, Habivista stores feature.properties.distanceKm.
The calculation is:
- Read the stored neighbourhood centre:
centerLatandcenterLng. - Convert the source facility into GeoJSON.
- Select a representative coordinate for the facility.
- Calculate the great-circle distance between the neighbourhood centre and that representative coordinate.
- Store the result in kilometres, rounded to one decimal place.
The code uses Turf's distance function with kilometre units. Conceptually, this is the same as measuring the shortest distance over the earth's surface between two latitude/longitude points.
How the facility coordinate is chosen
Facilities can be points, lines, polygons, or multipolygons. A school may be mapped as a single point, while a park may be mapped as a polygon. Habivista normalizes those geometries into one representative coordinate before distance is calculated.
- Point: the point coordinate itself.
- MultiPoint: the centre of the point collection.
- LineString or MultiLineString: the centre of the line geometry.
- Polygon or MultiPolygon: the centre of the geometry's bounding box.
- GeometryCollection: the centre when supported, otherwise an average of child coordinates.
This approach keeps the seed process simple, repeatable, and fast. The tradeoff is that a large park may show distance to the park's geometric centre rather than the nearest entrance.
Boundary clipping and radius fallback
When a usable neighbourhood boundary exists, Habivista attempts to keep facilities inside or touching that boundary. Polygon features are clipped to the boundary where possible. Point and line features are retained only when they intersect or sit inside the boundary.
If boundary clipping would remove every feature from a layer, the seed falls back to the search-radius result for that layer. This prevents the UI from going blank when OpenStreetMap has an incomplete, overly tight, or disputed neighbourhood boundary.
Current search radiuses are intentionally conservative:
- Schools: 1.5 km.
- Healthcare: 1.5 km.
- Markets: 1.5 km.
- Green space: 1.5 km.
- Bus stops: 1.2 km.
- Indicative flood context: 0.9 km.
Duplicate handling
OpenStreetMap may represent the same real-world place more than once. For example, a clinic can appear as both a node and a building polygon, or a bus stop can be repeated along the same road with very similar names.
Habivista uses an RBush spatial index to deduplicate facilities by:
- normalized name,
- category,
- proximity,
- geometry representative point.
When duplicates are merged, the retained feature can record a merged count and reduced confidence. This helps avoid cases where the same clinic or school appears twice on the map and artificially improves a score.
Score model relationship
Facility distance is one input into the GIS layer score. For access layers such as schools, healthcare, markets, green space, and bus stops, higher scores generally mean better access.
The model considers:
- mapped feature count,
- nearest mapped feature distance,
- approximate mapped green area for green-space layers.
For flood context, the score is different: a higher stored flood score means higher indicative exposure. It uses nearby mapped water features, nearest water-feature distance, and low-weight regional EONET support. Flood context is not a parcel-level flood-risk certificate.
Optional route evidence
When a Valhalla routing backend is configured, Habivista can store optional route evidence:
- travel minutes,
- route distance in kilometres,
- route mode,
- route source,
- route confidence.
This evidence is seed-time only. It does not replace distanceKm yet, because walking and driving routes depend on road access, traffic, private gates, road condition, and transport mode. For trotro, Valhalla bus costing is treated as an indicative proxy, not a true trotro network model.
Green-space example
For a neighbourhood such as East Legon, the green-space process works like this:
- Query OSM green-space tags within 1.5 km of the East Legon centre.
- Convert returned OSM elements into GeoJSON.
- Clip or filter features against the mapped East Legon boundary when possible.
- Deduplicate near-identical features.
- Calculate
distanceKmfrom the East Legon centre to each green-space representative coordinate. - Score the layer using mapped count, nearest distance, and mapped green area.
- Optionally add raster green-cover evidence if a configured local GeoTIFF is available.
What users should know
Facility distances are useful for comparison, but they are not inspection advice. Before making a rental or purchase decision, users should still confirm:
- the exact property entrance,
- the actual walking route,
- night-time safety and lighting,
- traffic at the times they commute,
- school catchment or admission requirements,
- whether a facility is still open and operating,
- flood history from local residents, landlords, insurers, and official sources.
Why this method is transparent
Habivista stores the source, category, confidence, and distance with each mapped feature. That makes the layer auditable. If a source item is wrong, we can trace it to the OSM id or source label, reject it in future overrides, and reseed the layer without changing the runtime application.
The long-term direction is to keep the runtime fast and predictable while improving the seed pipeline with better source data, local overrides, authoritative Ghana datasets, and stronger route or raster evidence where available.